Prometheus 监控 Nginx
一、Nginx_exporter安装
下载链接:
https://github.com/discordianfish/nginx_exporter
下载nginx_exporter的docker镜像。
docker pull fish/nginx-exporter
先run一下,执行之后,会hold住,先不要关闭窗口。
docker run -it fish/nginx-exporter
新开一个窗口,查看docker进程
root@ubuntu:~# docker ps|grep nginx-exporter5baa06db43d9 fish/nginx-exporter "/usr/local/bin/ngin…" 13 minutes ago Up 13 minutes 9113/tcp lucid_germain
复制编译后的文件到/opt
docker cp 5baa06db43d9:/usr/local/bin/nginx_exporter /opt/
执行帮助命令:
root@ubuntu:~# /opt/nginx_exporter --helpUsage of /opt/nginx_exporter:
  -insecure
        Ignore server certificate if using https (default true)
  -nginx.scrape_uri string
        URI to nginx stub status page (default "http://localhost/nginx_status")
  -telemetry.address string
        Address on which to expose metrics. (default ":9113")
  -telemetry.endpoint string
        Path under which to expose metrics. (default "/metrics")
如果能执行成功,说明脚本可以运行了。
然后使用Ctrl+c 关闭docker容器。
二、Nginx开启状态
在线安装nginx
安装nginx
apt-get install -y nginx
编译安装nginx
wget -c http://mirror.nienbo.com/nginx/nginx-1.12.1.tar.gztar -zxvf nginx-1.12.1.tar.gz
cd nginx-1.12.1./configure --prefix=/usr/local/nginx --with-http_stub_status_module
make
make install
编辑配置文件
vi /etc/nginx/sites-enabled/status.conf
注意:这是在线安装nginx的路径。请根据实际情况修改。
内容如下:
server {       listen 8011;       server_name localhost;       location /nginx_status {           stub_status on;           access_log off;           allow 127.0.0.1;
       }
}
重新加载配置文件
nginx -s reload
访问nginx状态页面
root@ubuntu:/etc/nginx/sites-enabled# curl 127.0.0.1:8011/nginx_statusActive connections: 2 server accepts handled requests 6 6 15 Reading: 0 Writing: 1 Waiting: 1
三、nginx_exporter封装service服务
创建nginx_exporter目录,移动文件
mkdir -p /etc/nginx_exporter/bin/mv /opt/nginx_exporter /etc/nginx_exporter/bin/
封装service
vim /lib/systemd/system/nginx_exporter.service
内容如下:
[Unit]Description=nginx monitorAfter=network.target[Service]ExecStart=/etc/nginx_exporter/bin/nginx_exporter -nginx.scrape_uri="http://127.0.0.1:8011/nginx_status"ExecStop=-/sbin/start-stop-daemon --quiet --stop --retry QUIT/5TimeoutStopSec=5KillMode=mixed[Install]WantedBy=multi-user.target
重新加载service配置文件,设置开机自启动,并启动服务
systemctl daemon-reloadsystemctl enable nginx_exporter.servicesystemctl start nginx_exporter.service
查看端口
root@ubuntu:/etc/nginx/sites-enabled# netstat -anpt|grep nginx_exportetcp 0 0 127.0.0.1:33780 127.0.0.1:8011 ESTABLISHED 19006/nginx_exportetcp6 0 0 :::9113 :::* LISTEN 19006/nginx_exportetcp6 0 0 192.168.1.24:9113 172.17.0.2:50776 ESTABLISHED 19006/nginx_exporte
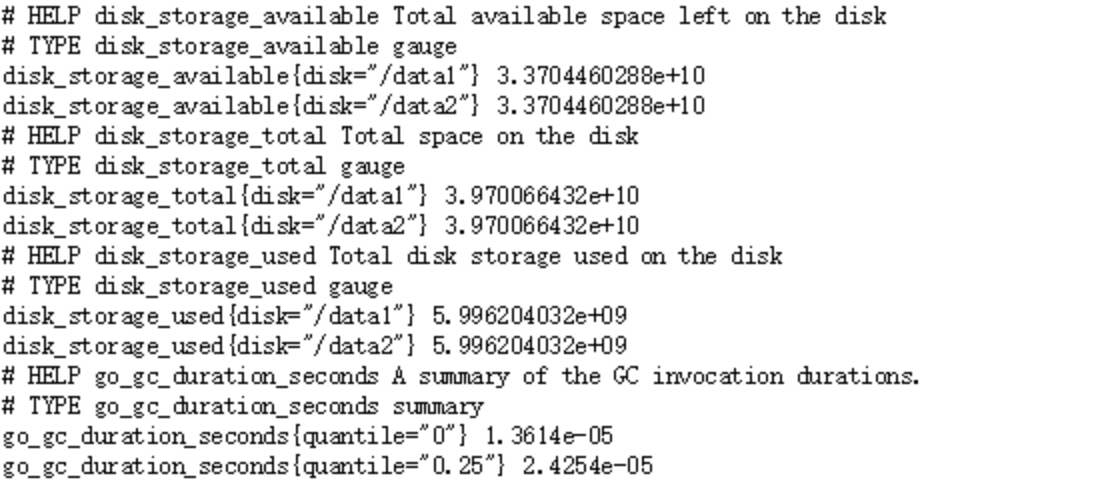
使用网页访问metrics
http://192.168.1.24:9113/metrics
效果如下:
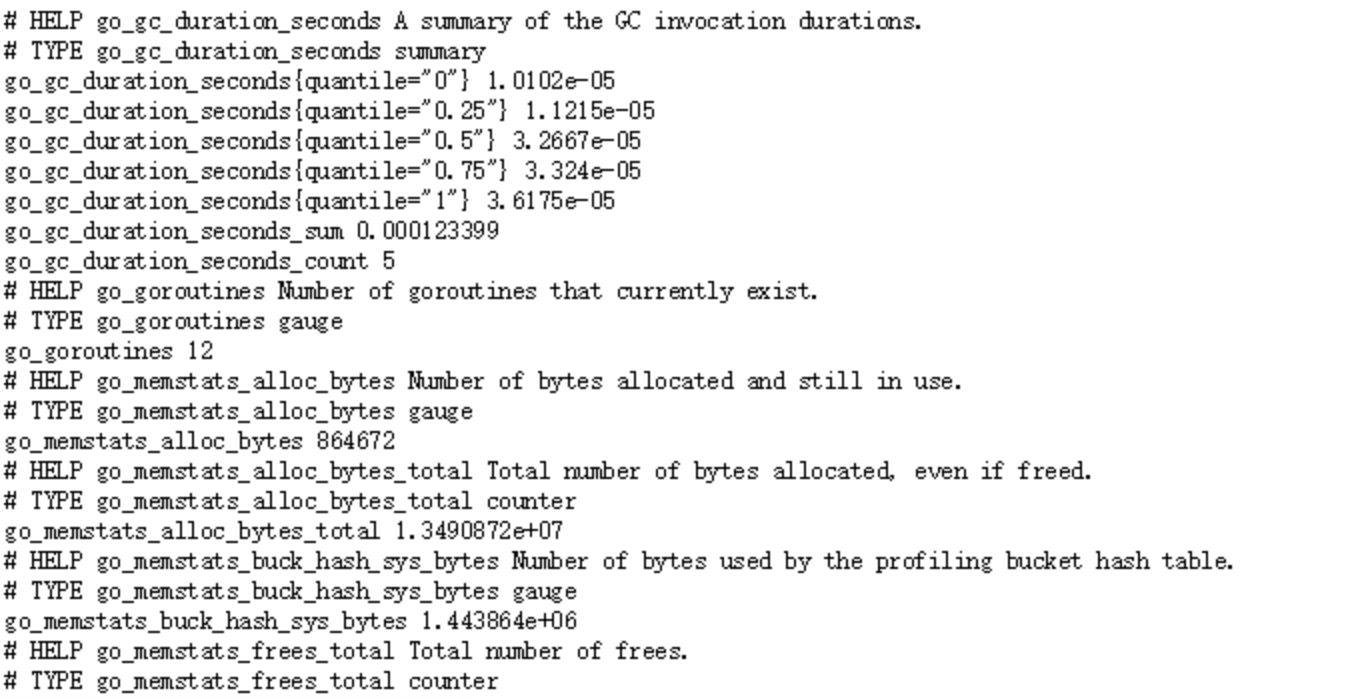
如果数据输出正常,则表示成功。
四、promethus增加job
vim /opt/prometheus/prometheus.yml
增加以下内容:
- job_name: nginx_exporterstatic_configs:
  - targets:
    - 192.168.1.24:9113
    labels:
      instance: nginx-24
重启prometheus,访问页面:
http://192.168.1.24:9090/targets
确保nginx_exporter状态为UP

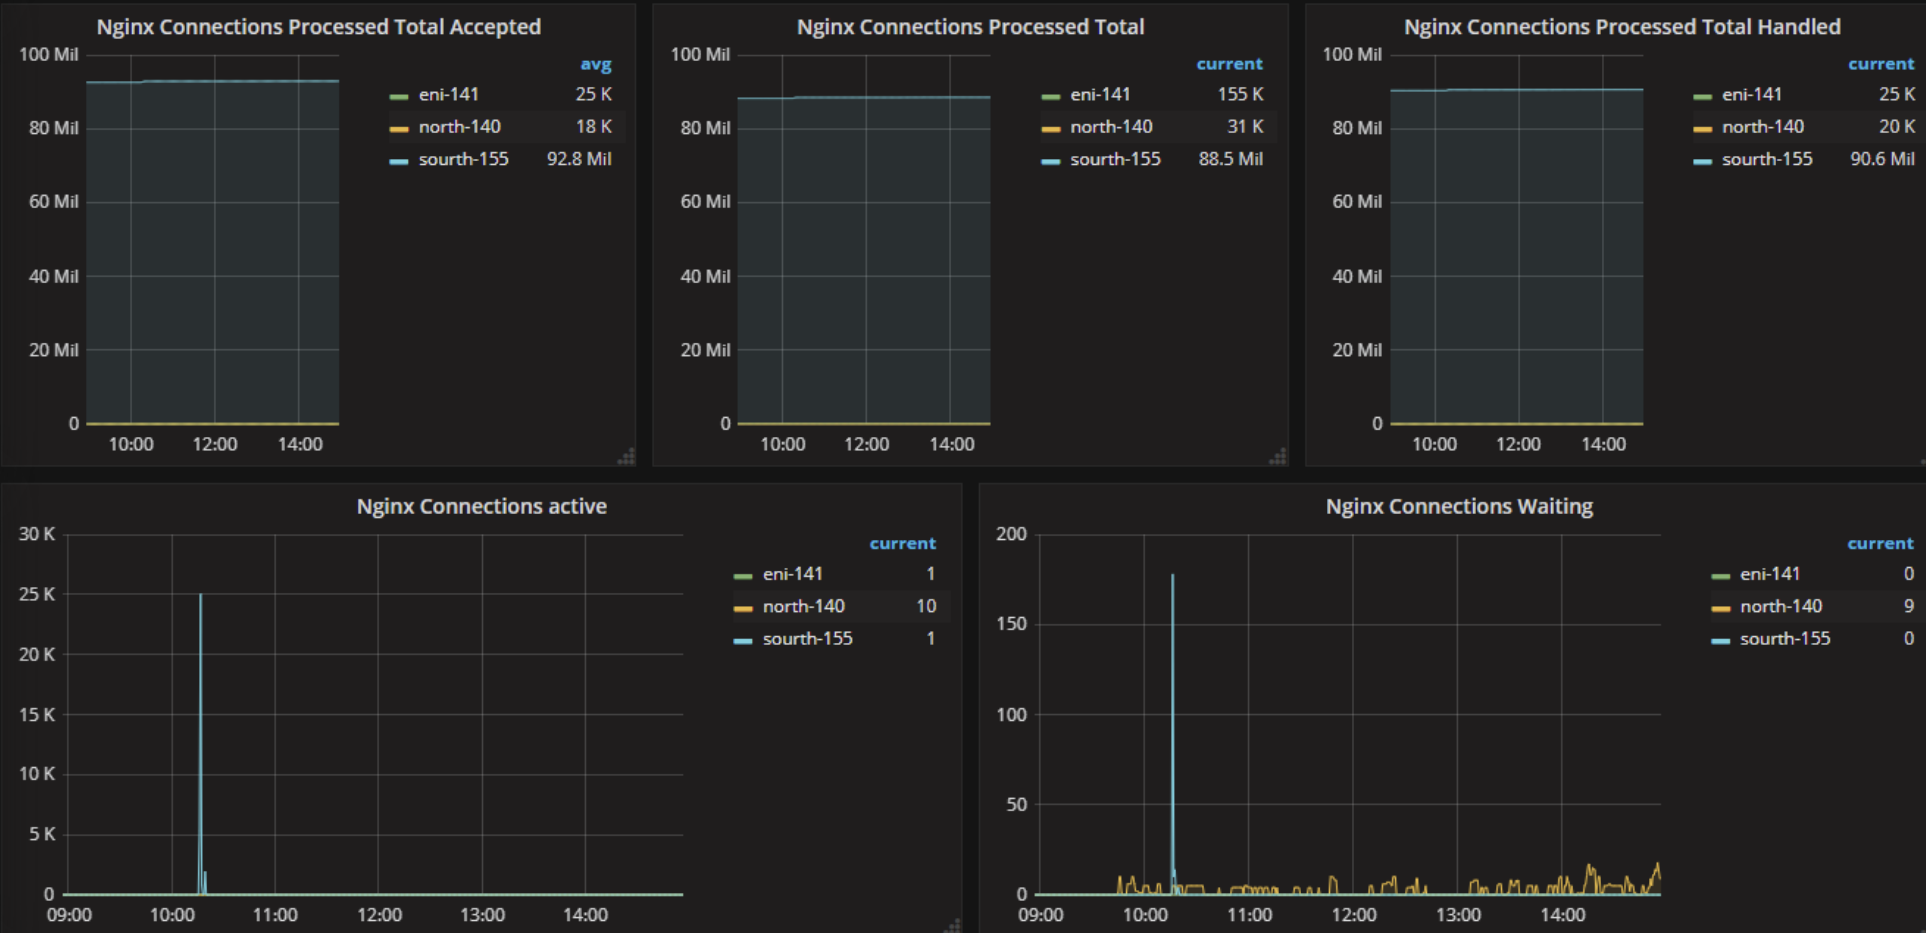
五、Grafana导入Dashboards
下载json文件
https://files.cnblogs.com/files/xiao987334176/Nginx%E7%9B%91%E6%8E%A7-1563001010074.zip
解压之后,里面就是一个json文件
点击import

上传json文件,设置Name,选择prometheus,点击import

等待一段时间,数据多了之后,效果如下: