
grafana7 监控https证书过期时间
使用 Grafana 7 中new table visualization功能,使用Prometheus监视证书的到期日期,并使用Grafana进行
展示。
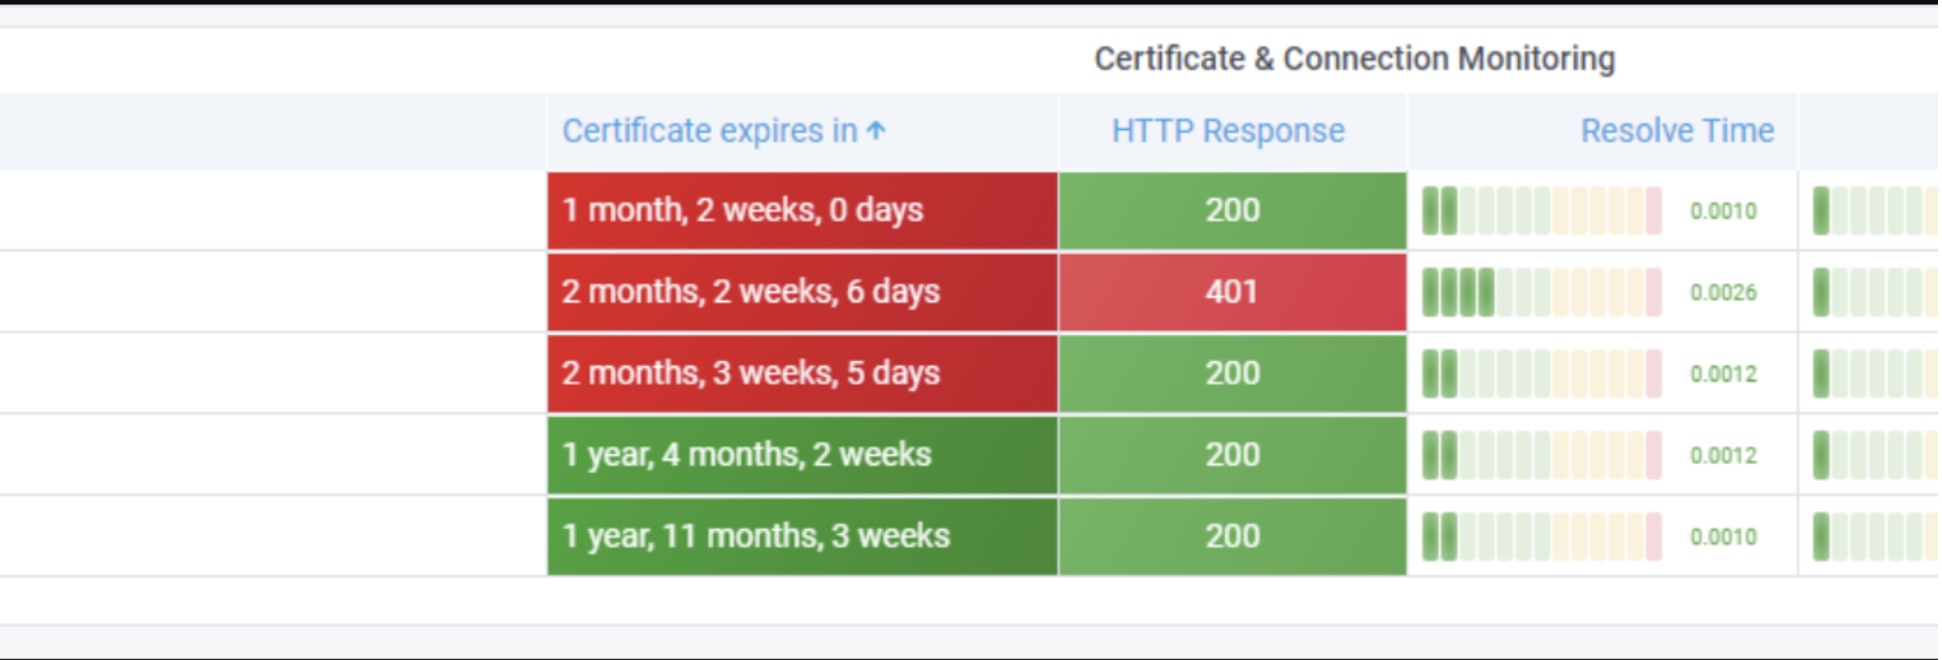
所有证书一目了然:证书到期之前的剩余时间,HTTP状态码和连接时间等等
导出和获取指标
使用 blackbox_exporter 收集此数据需要的一切指标,blackbox exporter 可以监控 http/https 页面,ip、端口等。
在这里我们使用它监控 [host:port] ,可以获取SSL证书信息,并从中自动捕获到期日期,并使用probe_ssl_earliest_cert_expiry指标计算剩余时间。
以下是配置,非常简单:
modules:
  http_2xx:
    prober: http
    http:
            preferred_ip_protocol: "ip4"
            tls_config:
                    insecure_skip_verify: true
prometheus.yml 添加一个 job
- job_name: 'blackbox'
    metrics_path: /probe
    params:
      module: [http_2xx]    static_configs:
      - targets:
              - https://xx.com
              - https://baidu.com
    relabel_configs:
      - source_labels: [__address__]        target_label: __param_target
      - source_labels: [__param_target]        target_label: instance
      - target_label: __address__
        replacement: <blackboxexporter_IP>:9115  # Blackbox exporter scraping address
展示所有指标
现在已经收集到了指标,接下来就要在 Grafana 展示这些内容了。使用https://grafana.com/grafana/dashboards/13230 这个模板。
下面是几个尽量简单的例子:
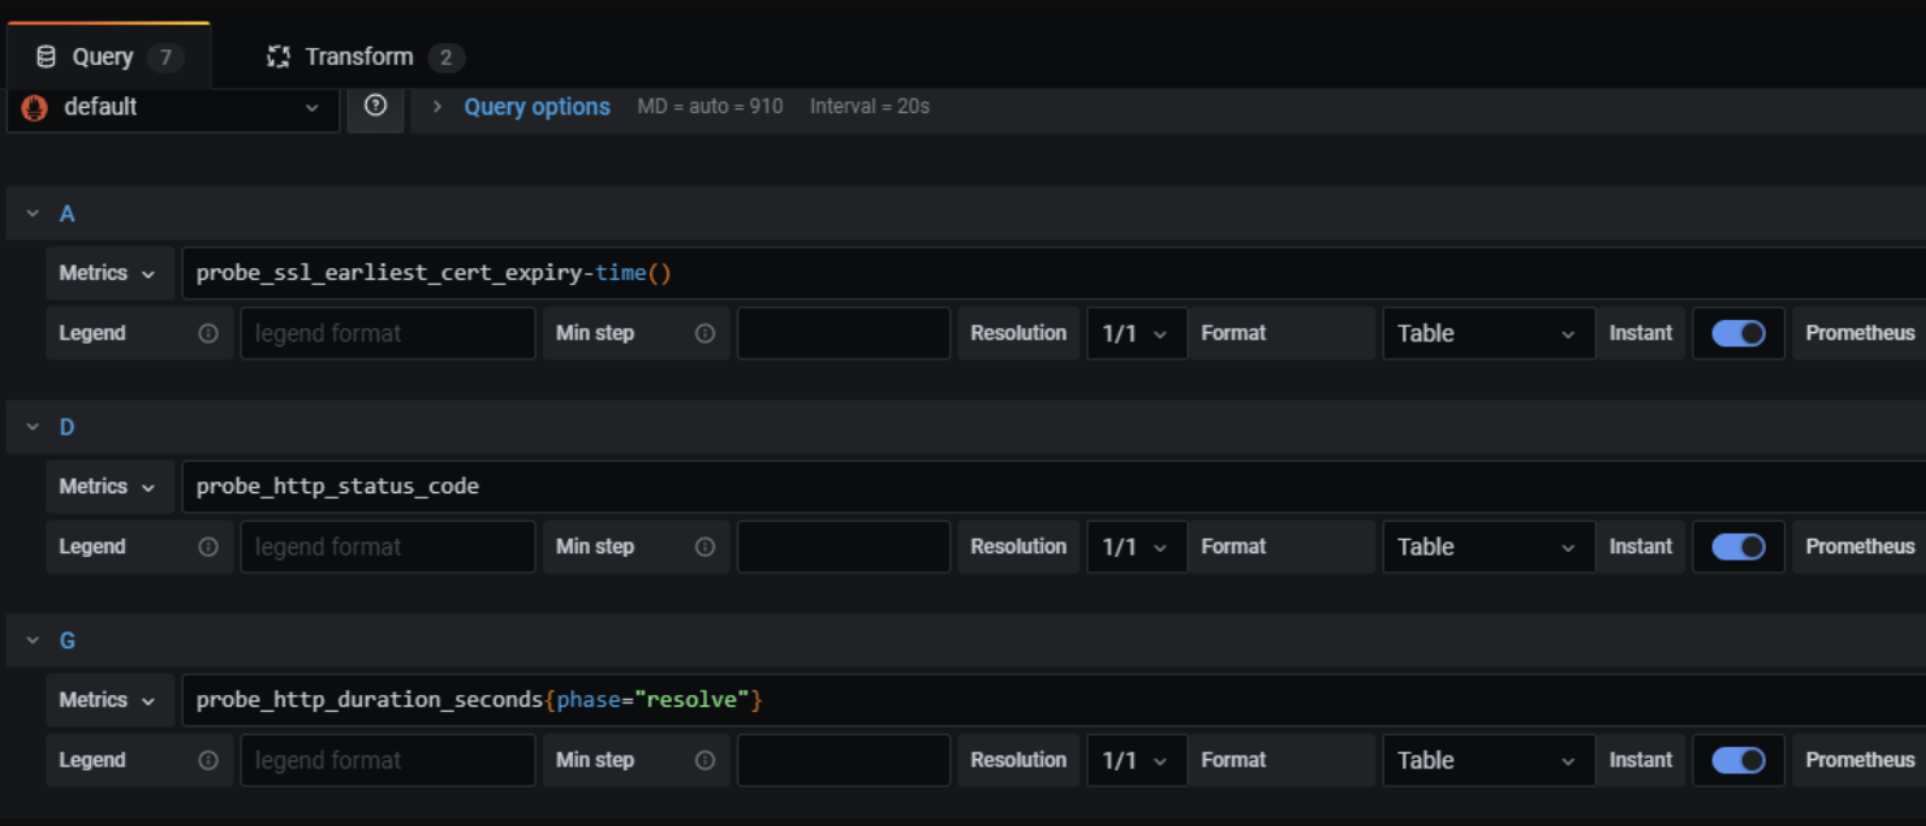
剩余时间:
probe_ssl_earliest_cert_expiry-time()
HTTP 状态码:
probe_http_status_code
所有 HTTP duration 查询:
probe_http_duration_seconds{phase="resolve"}
probe_http_duration_seconds{phase="connect"}
probe_http_duration_seconds{phase="tls"}
probe_http_duration_seconds{phase="processing"}
probe_http_duration_seconds{phase="transfer"}
转换功能
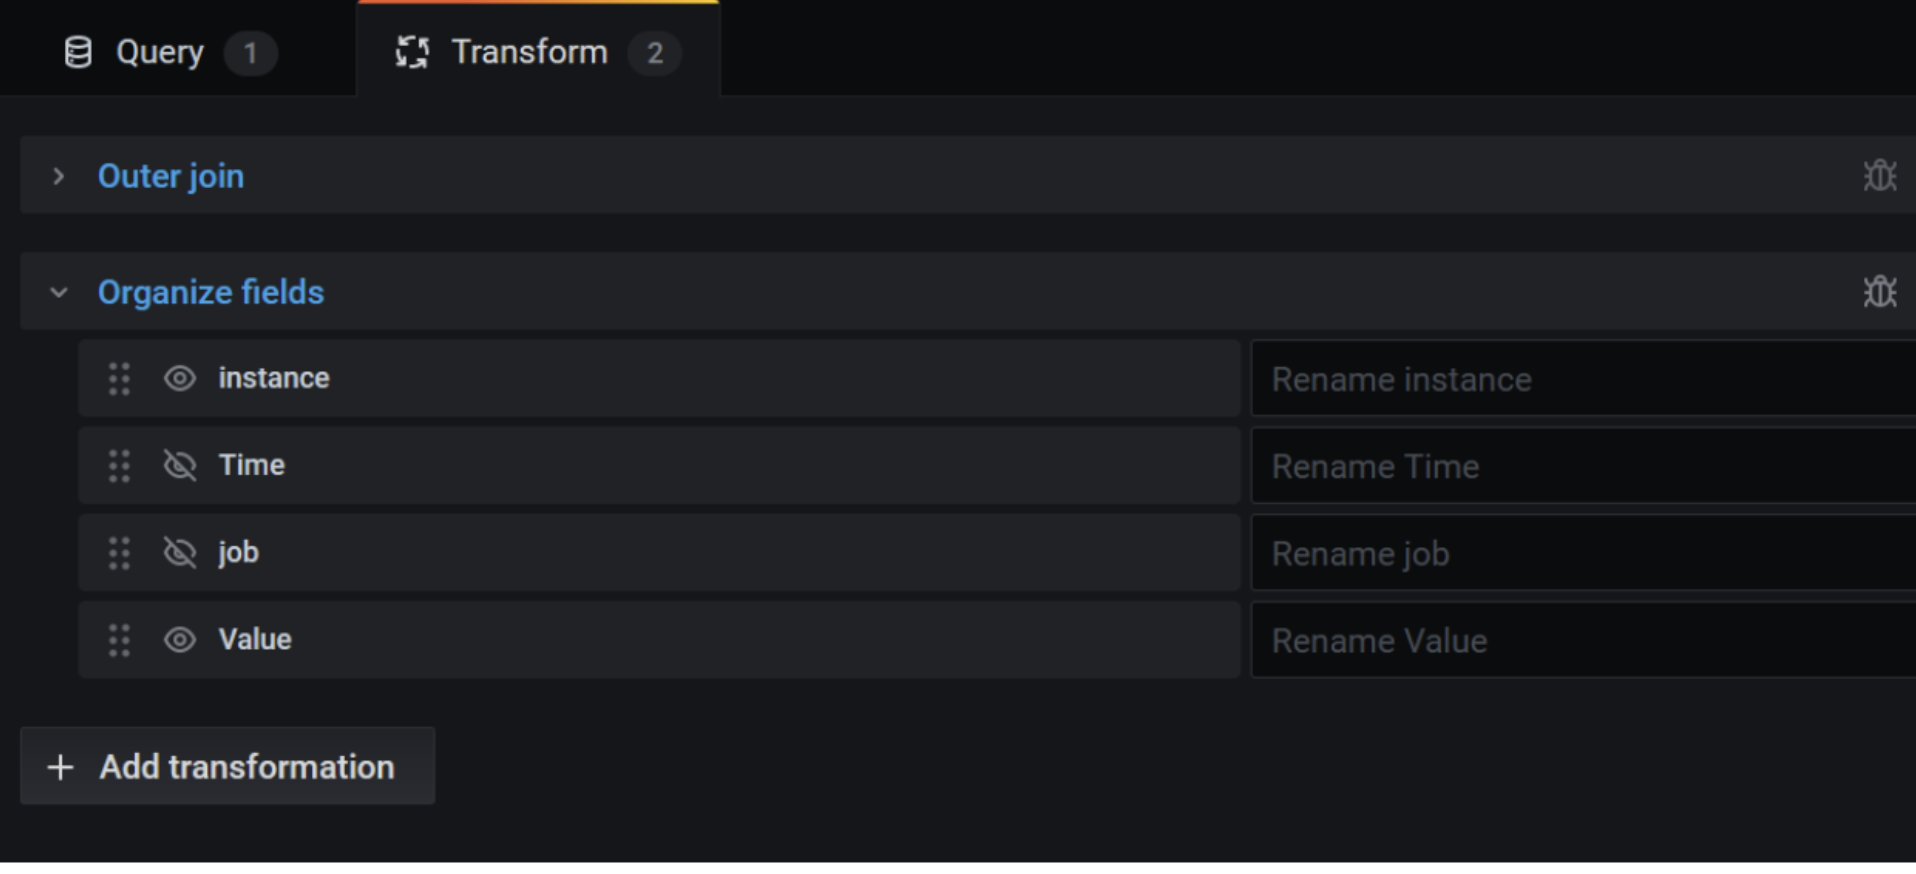
我们还利用了Grafana 7的 Transform 功能:在 instance 字段上使用 Outer join 将所有查询的结果一起显示在一行上。
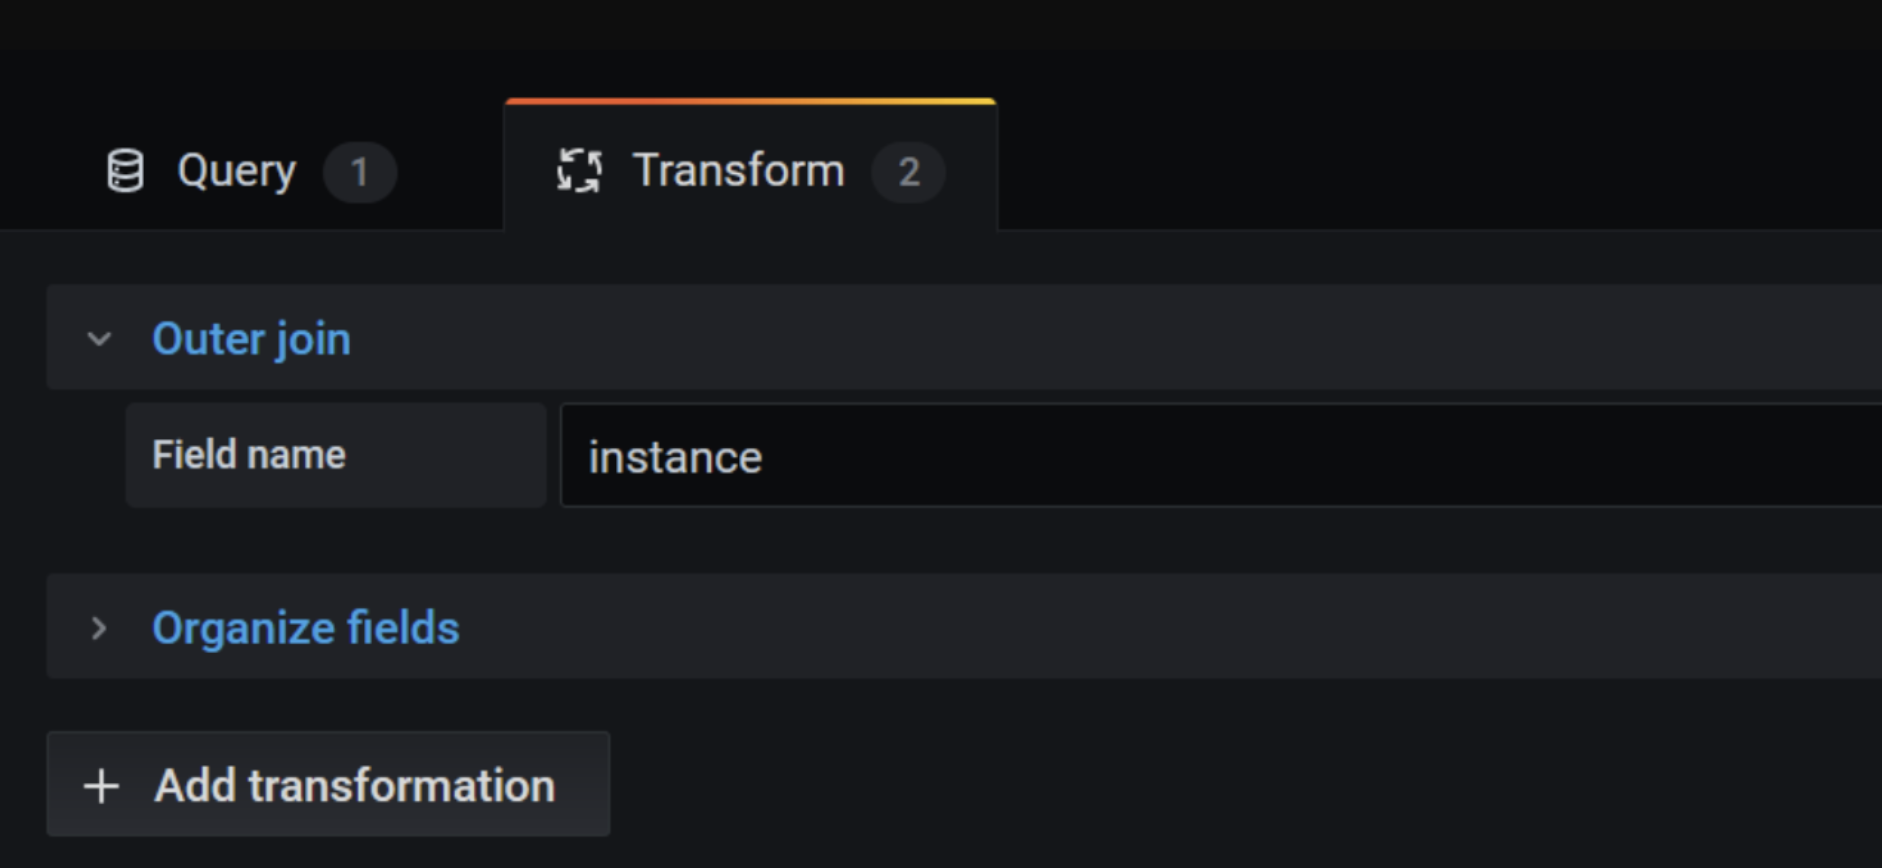
该组织字段转换也被用来过滤显示在我们的面板上
告警
虽然我们在 Grafana 做了展示,但是我们不会经常去看的,所以还是要在 Prometheus 设置告警,这样在证书过期时会收到通知。
- name: ssl_expiry
  rules:
  - alert: Ssl Cert Will Expire in 30 days
    expr: probe_ssl_earliest_cert_expiry - time() < 86400 * 30
    for: 5m
    labels:
      severity: warning
    annotations:
      summary: "SSL certificate will expire soon on (instance {{ $labels.instance }})"
      description: "SSL certificate expires in 30 days\n  VALUE = {{ $value }}\n  LABELS: {{ $labels }}"
当然你也可以修改为其他时间,比如 10 天,那表达式就改为:
expr: probe_ssl_earliest_cert_expiry - time() < 86400 * 10
需要同步修改警报名称和描述