大数据集群监控配置操作指导(四)Spark监控使用jmx
graphite_exporter方式
Graphite 来收集度量标准,Grafana 则用于构建仪表板,首先,需要配置 Spark 以将 metrics 报告到 Graphite。
prometheus 提供了一个插件(graphite_exporter),可以将 Graphite metrics 进行转化并写入 Prometheus (本文的方式)。
先去https://prometheus.io/download/下载graphite_exporter。
wget https://github.com/prometheus/graphite_exporter/releases/download/v0.13.1/graphite_exporter-0.13.1.linux-amd64.tar.gz
解压并修改为graphite_exporter
[root@hd1 exporters]# tar -xvf graphite_exporter-0.13.1.linux-amd64.tar.gz
graphite_exporter-0.13.1.linux-amd64/
graphite_exporter-0.13.1.linux-amd64/LICENSE
graphite_exporter-0.13.1.linux-amd64/NOTICE
graphite_exporter-0.13.1.linux-amd64/graphite_exporter
graphite_exporter-0.13.1.linux-amd64/getool
[root@hd1 exporters]# mv graphite_exporter-0.13.1.linux-amd64 graphite_exporter
进入到graphite_exporter下
创建graphite_exporter_mapping文件:
vim graphite_exporter_mapping
添加如下内容
mappings:
- match: '*.*.executor.filesystem.*.*'
name: spark_app_filesystem_usage
labels:
application: $1
executor_id: $2
fs_type: $3
qty: $4
- match: '*.*.jvm.*.*'
name: spark_app_jvm_memory_usage
labels:
application: $1
executor_id: $2
mem_type: $3
qty: $4
- match: '*.*.executor.jvmGCTime.count'
name: spark_app_jvm_gcTime_count
labels:
application: $1
executor_id: $2
- match: '*.*.jvm.pools.*.*'
name: spark_app_jvm_memory_pools
labels:
application: $1
executor_id: $2
mem_type: $3
qty: $4
- match: '*.*.executor.threadpool.*'
name: spark_app_executor_tasks
labels:
application: $1
executor_id: $2
qty: $3
- match: '*.*.BlockManager.*.*'
name: spark_app_block_manager
labels:
application: $1
executor_id: $2
type: $3
qty: $4
- match: '*.*.DAGScheduler.*.*'
name: spark_app_dag_scheduler
labels:
application: $1
executor_id: $2
type: $3
qty: $4
- match: '*.*.CodeGenerator.*.*'
name: spark_app_code_generator
labels:
application: $1
executor_id: $2
type: $3
qty: $4
- match: '*.*.HiveExternalCatalog.*.*'
name: spark_app_hive_external_catalog
labels:
application: $1
executor_id: $2
type: $3
qty: $4
- match: '*.*.*.StreamingMetrics.*.*'
name: spark_app_streaming_metrics
labels:
application: $1
executor_id: $2
app_name: $3
type: $4
qty: $5
- match: '*.*.executor.filesystem.*.*'
name: filesystem_usage
labels:
application: $1
executor_id: $2
fs_type: $3
qty: $4
- match: '*.*.executor.threadpool.*'
name: executor_tasks
labels:
application: $1
executor_id: $2
qty: $3
- match: '*.*.executor.jvmGCTime.count'
name: jvm_gcTime_count
labels:
application: $1
executor_id: $2
- match: '*.*.executor.*.*'
name: executor_info
labels:
application: $1
executor_id: $2
type: $3
qty: $4
- match: '*.*.jvm.*.*'
name: jvm_memory_usage
labels:
application: $1
executor_id: $2
mem_type: $3
qty: $4
- match: '*.*.jvm.pools.*.*'
name: jvm_memory_pools
labels:
application: $1
executor_id: $2
mem_type: $3
qty: $4
- match: '*.*.BlockManager.*.*'
name: block_manager
labels:
application: $1
executor_id: $2
type: $3
qty: $4
- match: '*.driver.DAGScheduler.*.*'
name: DAG_scheduler
labels:
application: $1
type: $2
qty: $3
- match: '*.driver.*.*.*.*'
name: task_info
labels:
application: $1
task: $2
type1: $3
type2: $4
qty: $5
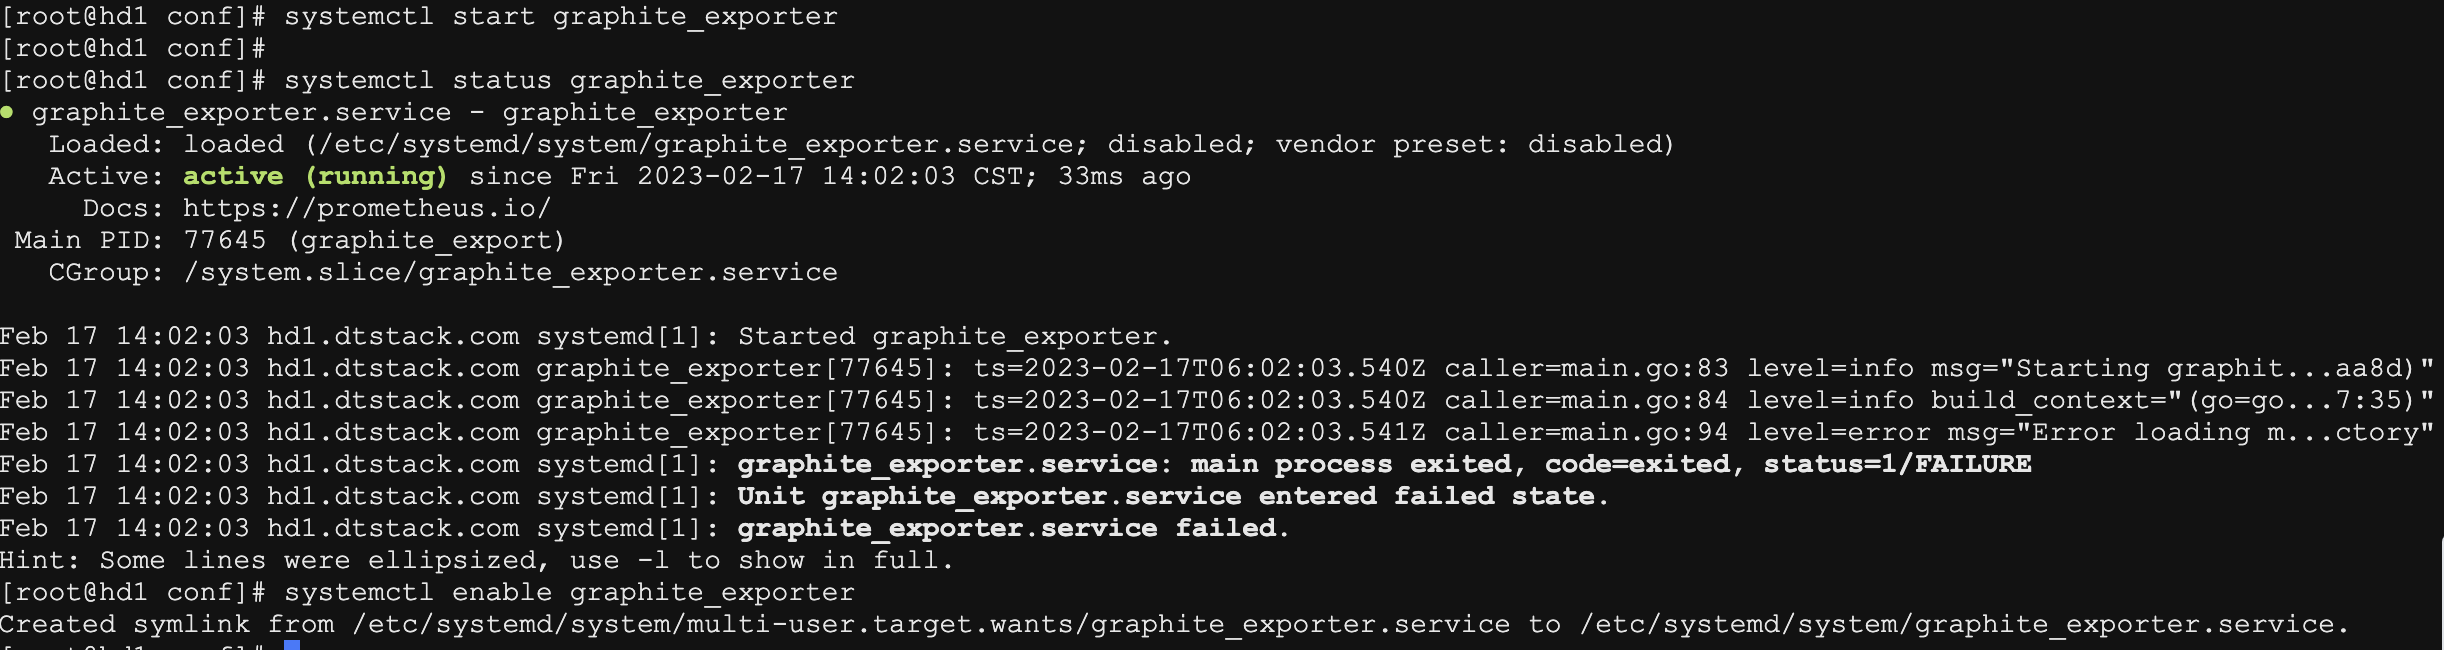
启动graphite_exporter(成功后 停止进程配置服务)
./graphite_exporter --graphite.mapping-config=graphite_exporter_mapping
配置成服务
vim /etc/systemd/system/graphite_exporter.service
[Unit]
Description=graphite_exporter
Documentation=https://prometheus.io/
After=network.target
[Service]
Type=simple
User=root
ExecStart=/opt/dtstack/exporters/graphite_exporter/graphite_exporter --graphite.mapping-config=/opt/dtstack/exporters/graphite_exporter/graphite_exporter_mapping
Restart=on-failure
[Install]
WantedBy=multi-user.target
启动graphite_exporter服务,并配置开机自启
systemctl daemon-reload
systemctl start graphite_exporter
systemctl status graphite_exporter
systemctl enable graphite_exporter
配置Prometheus
vim /opt/dtstack/prometheus-2.33.3/prometheus.yml
增加
- job_name: 'graphite_exporter'
static_configs:
- targets:
- ‘hd1:9108'
重启prometheus
在prometheus服务器上执行
systemctl restart prometheus
Spark配置Graphite metrics
Spark 是自带 Graphite Sink 的,
只需要配置一下metrics.properties;
进入到spark安装目录下,进入到conf目录下,找到metrics.properties
cd /opt/spark/conf/
vim metrics.properties
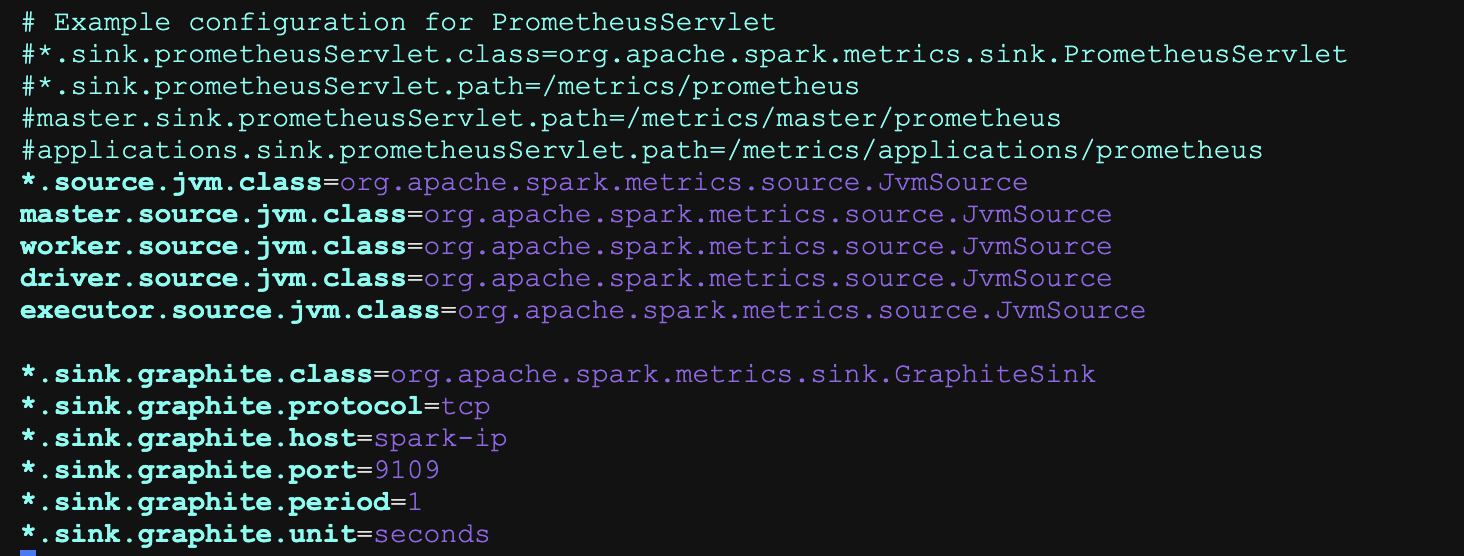
添加如下内容:(graphite_exporter 接收数据端口为9109)
*.source.jvm.class=org.apache.spark.metrics.source.JvmSource
master.source.jvm.class=org.apache.spark.metrics.source.JvmSource
worker.source.jvm.class=org.apache.spark.metrics.source.JvmSource
driver.source.jvm.class=org.apache.spark.metrics.source.JvmSource
executor.source.jvm.class=org.apache.spark.metrics.source.JvmSource
*.sink.graphite.class=org.apache.spark.metrics.sink.GraphiteSink
*.sink.graphite.protocol=tcp
*.sink.graphite.host=hd1(主机名)
*.sink.graphite.port=9109
*.sink.graphite.period=1
*.sink.graphite.unit=seconds
启动Spark程序
启动spark程序时,需要加上–files /usr/etc/spark/conf/metrics.properties参数。
./bin/spark-submit --class org.apache.spark.examples.SparkPi --master yarn --deploy-mode cluster --files /opt/spark/conf/metrics.properties --executor-cores 1 --queue default examples/jars/spark-examples_2.12-3.3.1.jar 10
shell:
./bin/spark-shell --files /opt/spark/conf/metrics.properties
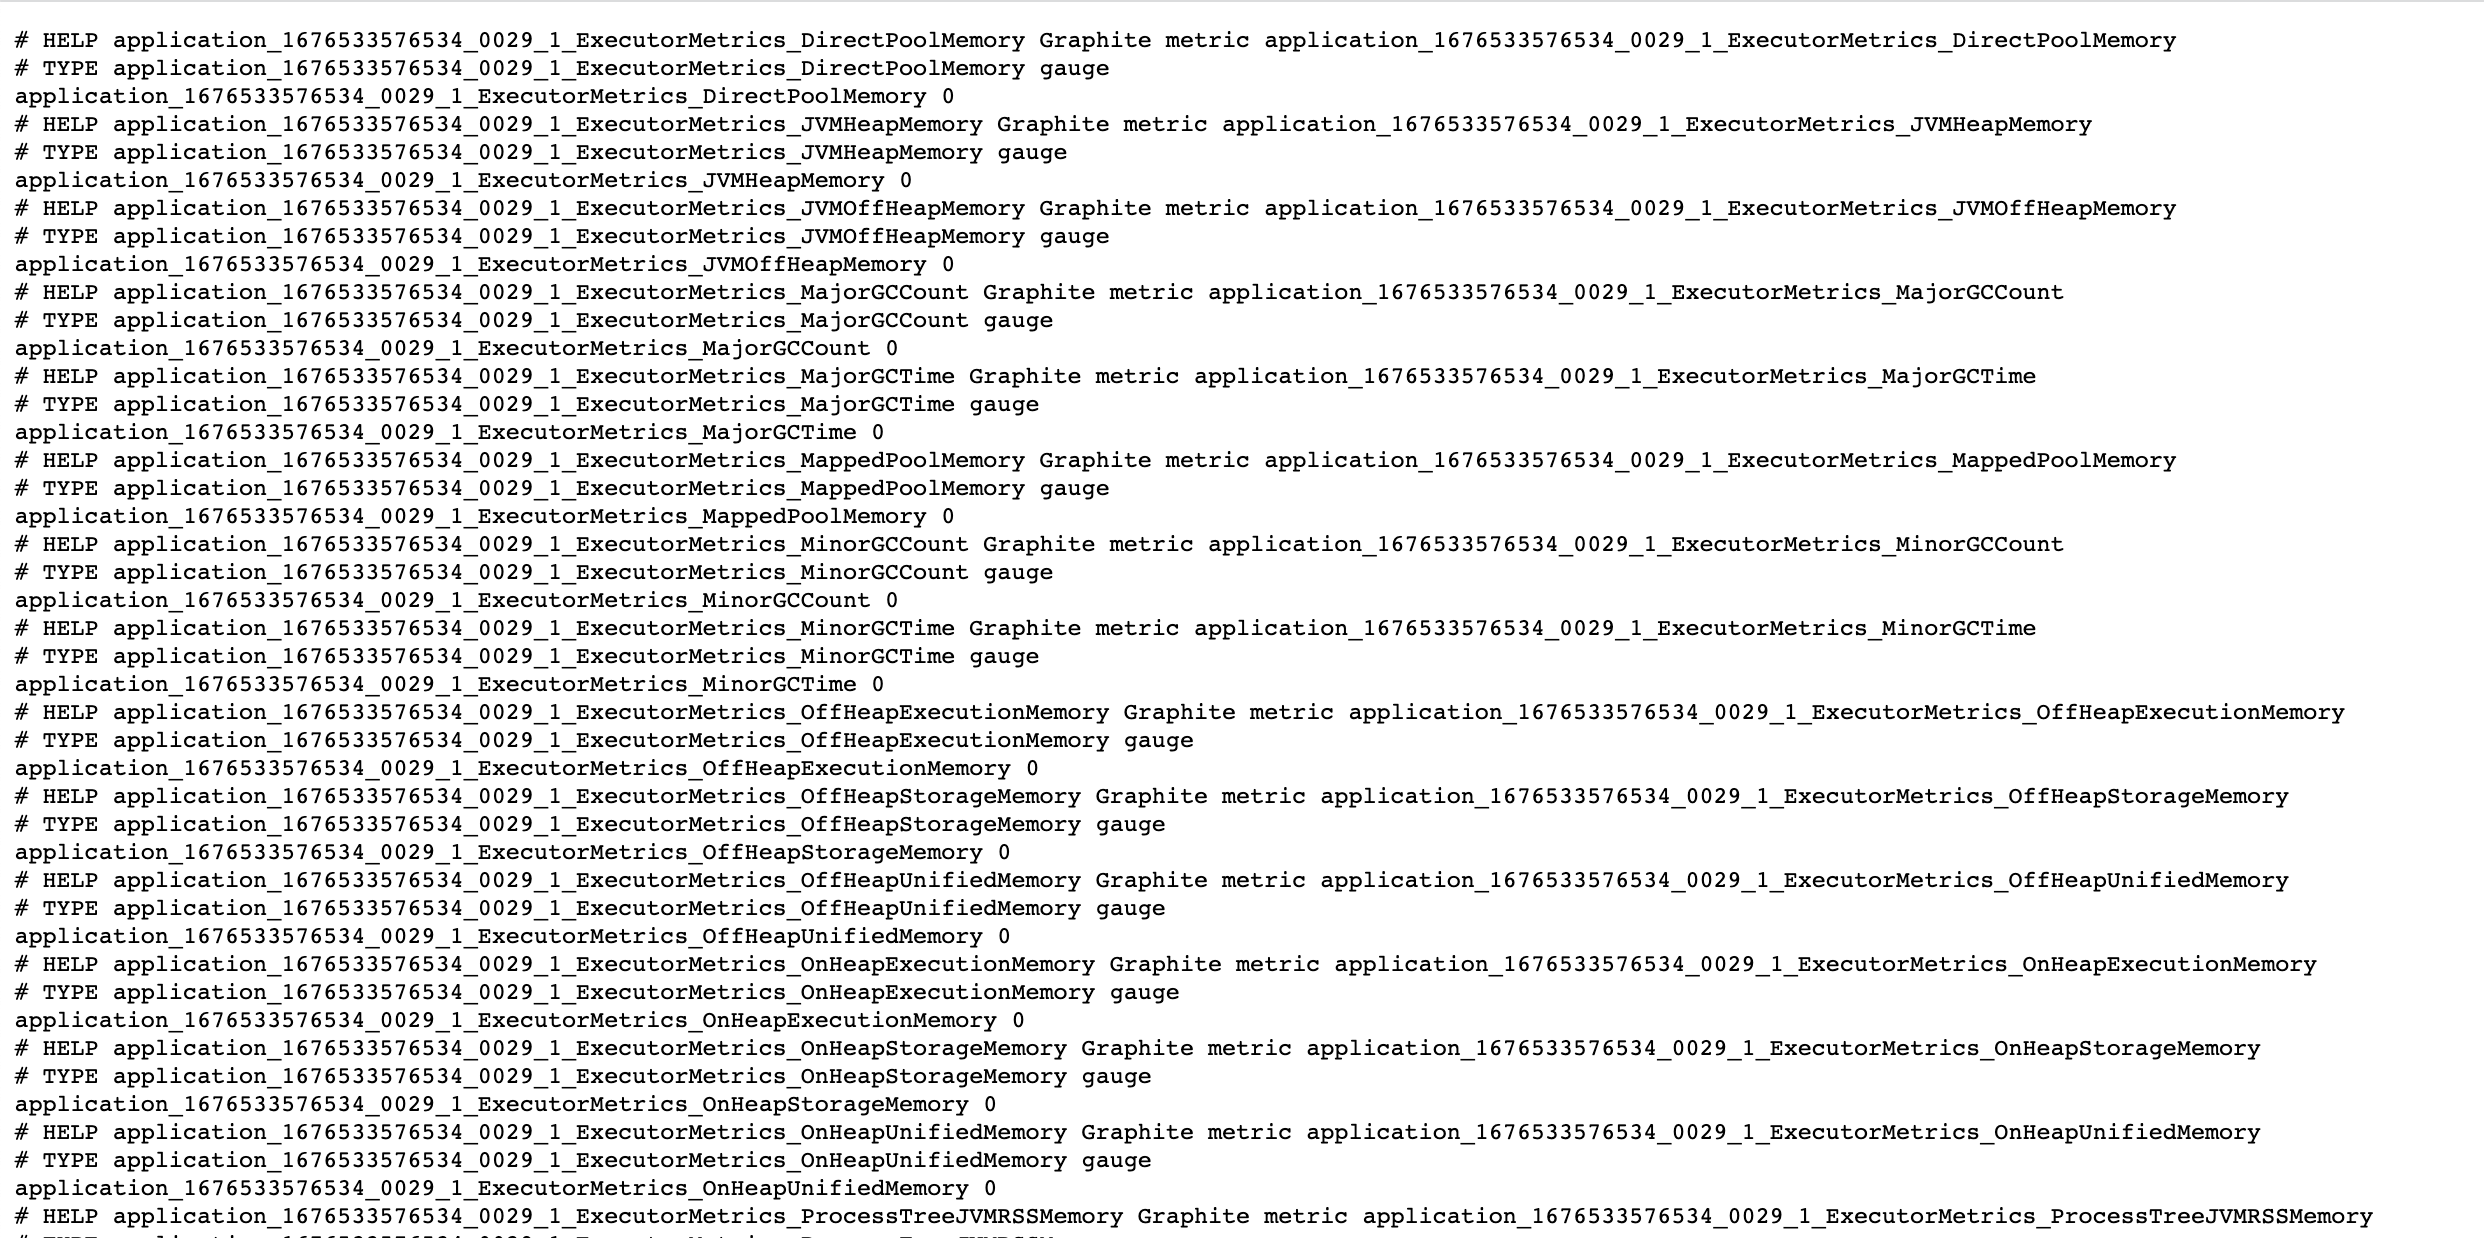
访问Prometheus是否收集到metrics数据
http://hd1:9108/metrics